Working capital trends in Europe
During COVID-19 and beyond
Cash is a daily necessity of any business, and one of the most important financial elements to get through a crisis unscathed. Without proper management, cash gets trapped in working capital through inefficient processes, limiting a company’s ability to invest in long-term growth. This article analyses recent working capital trends in Europe and explains how effectively managing working capital can help your business outperform the competition in growth, profitability and liquidity.
To understand how well a company is performing in these three areas of working capital – both against one’s past performance and peers – these components are each converted into days by comparing them to the daily average sales or COGS. These metrics are known as DSO, DIO and DPO, respectively (See below).
When combined, they are known as the cash conversion cycle (CCC), which expresses the time it takes to convert investment in inventories into cash flows from sales. Therefore, CCC attempts to estimate how long an input Euro is tied to the purchasing, manufacturing and sales processes before it is converted into cash receipts.
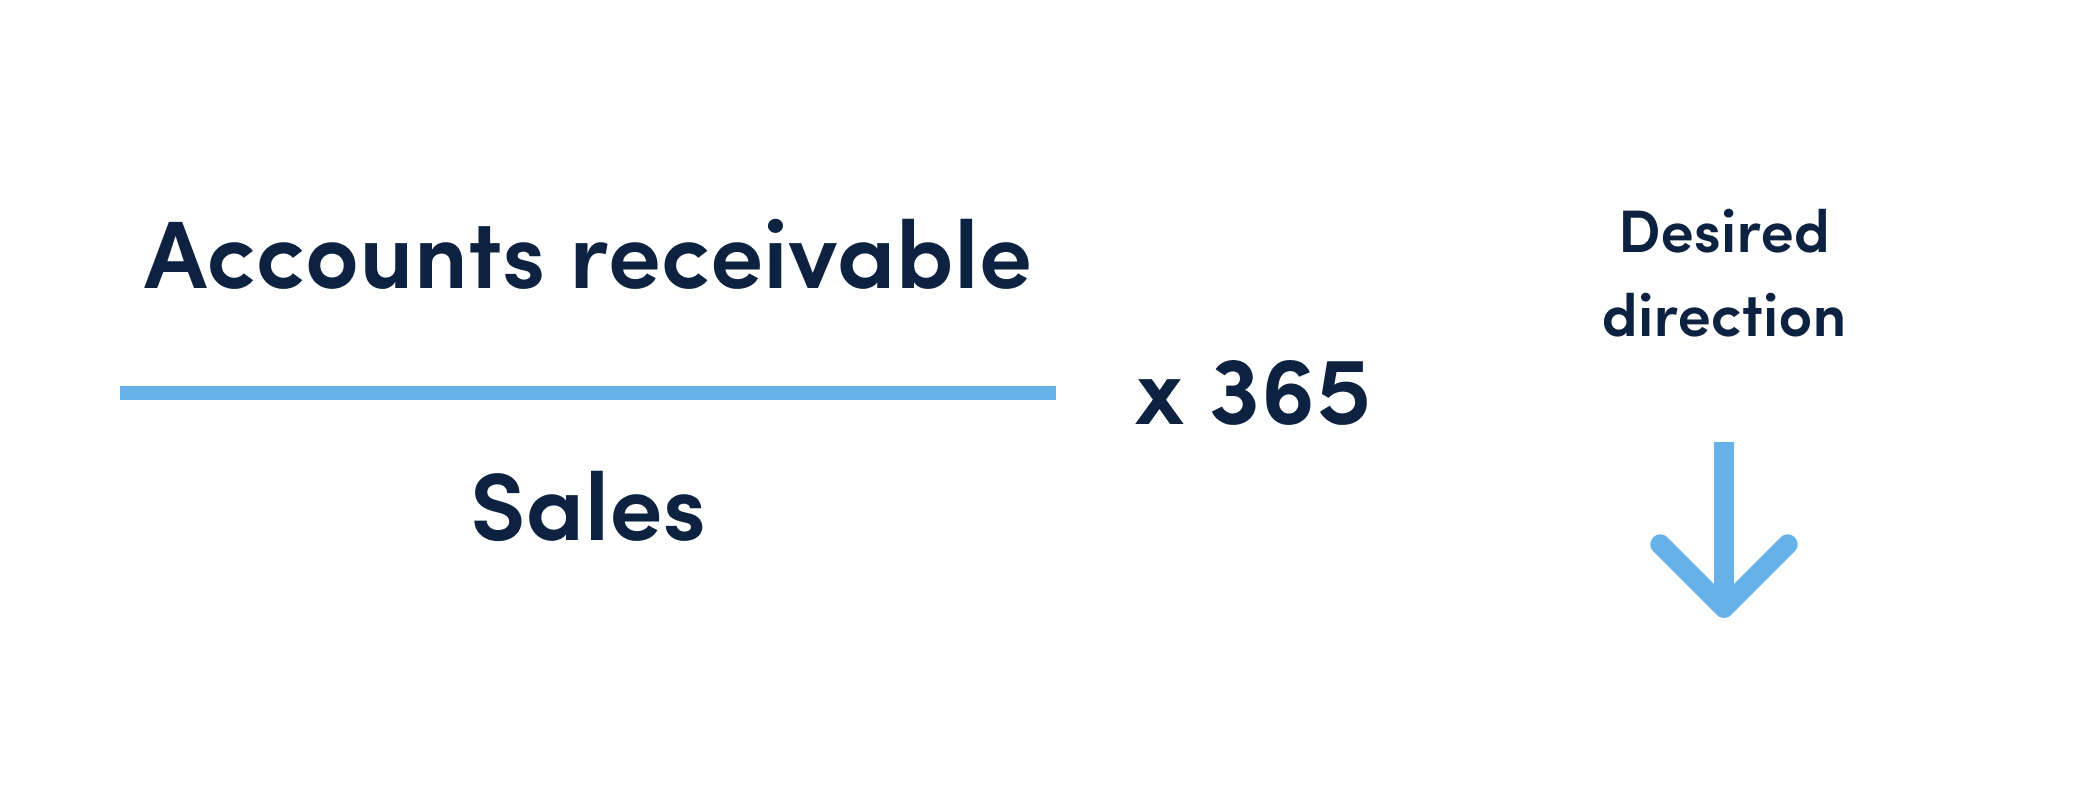

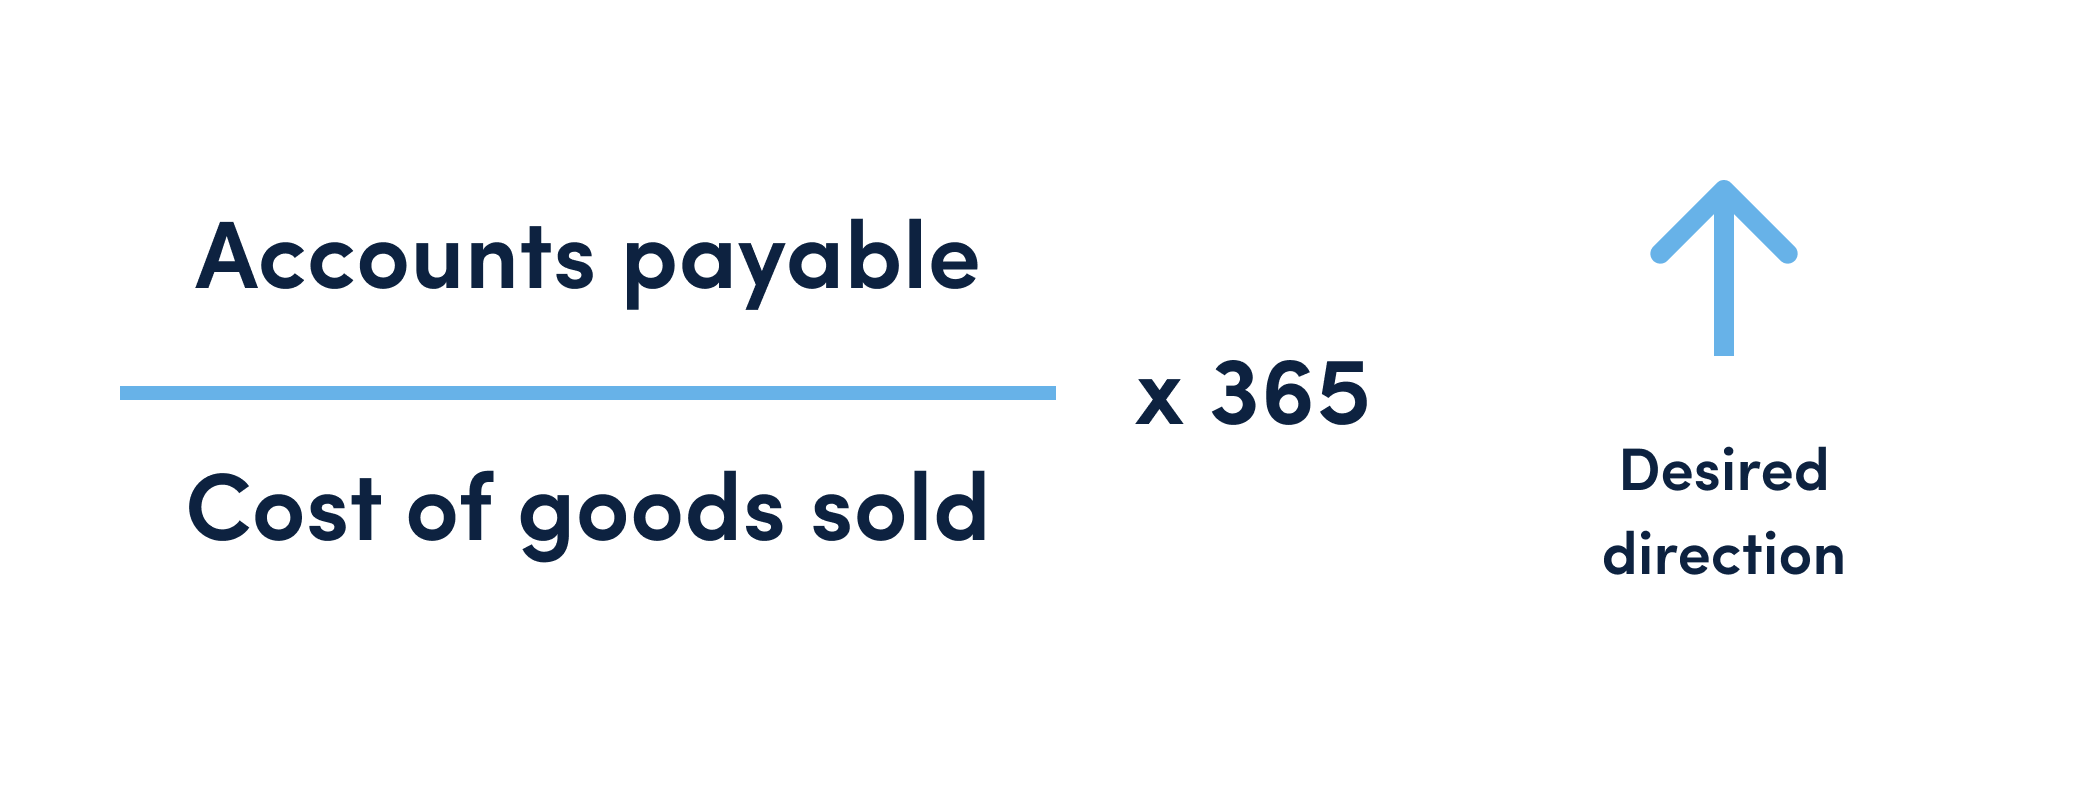

COVID-19 has pushed many European companies to obtain short term debt to finance working capital, hindering their ability to fund longer term investments for growth. Indeed, the Euro area banks reported a loan demand increase of 62% in Q2 2020, after a 26% increase already in Q1, bringing the net balance to its highest level since the European area bank lending survey started in 2003. However, there are better ways to obtain liquidity.
Consistent and sustainable improvements in working capital require complex structural alignment at the very core of the business. Only 4% of European companies have managed to do just this. Contrary to the common perception, these companies have also outperformed the market in EBITDA.
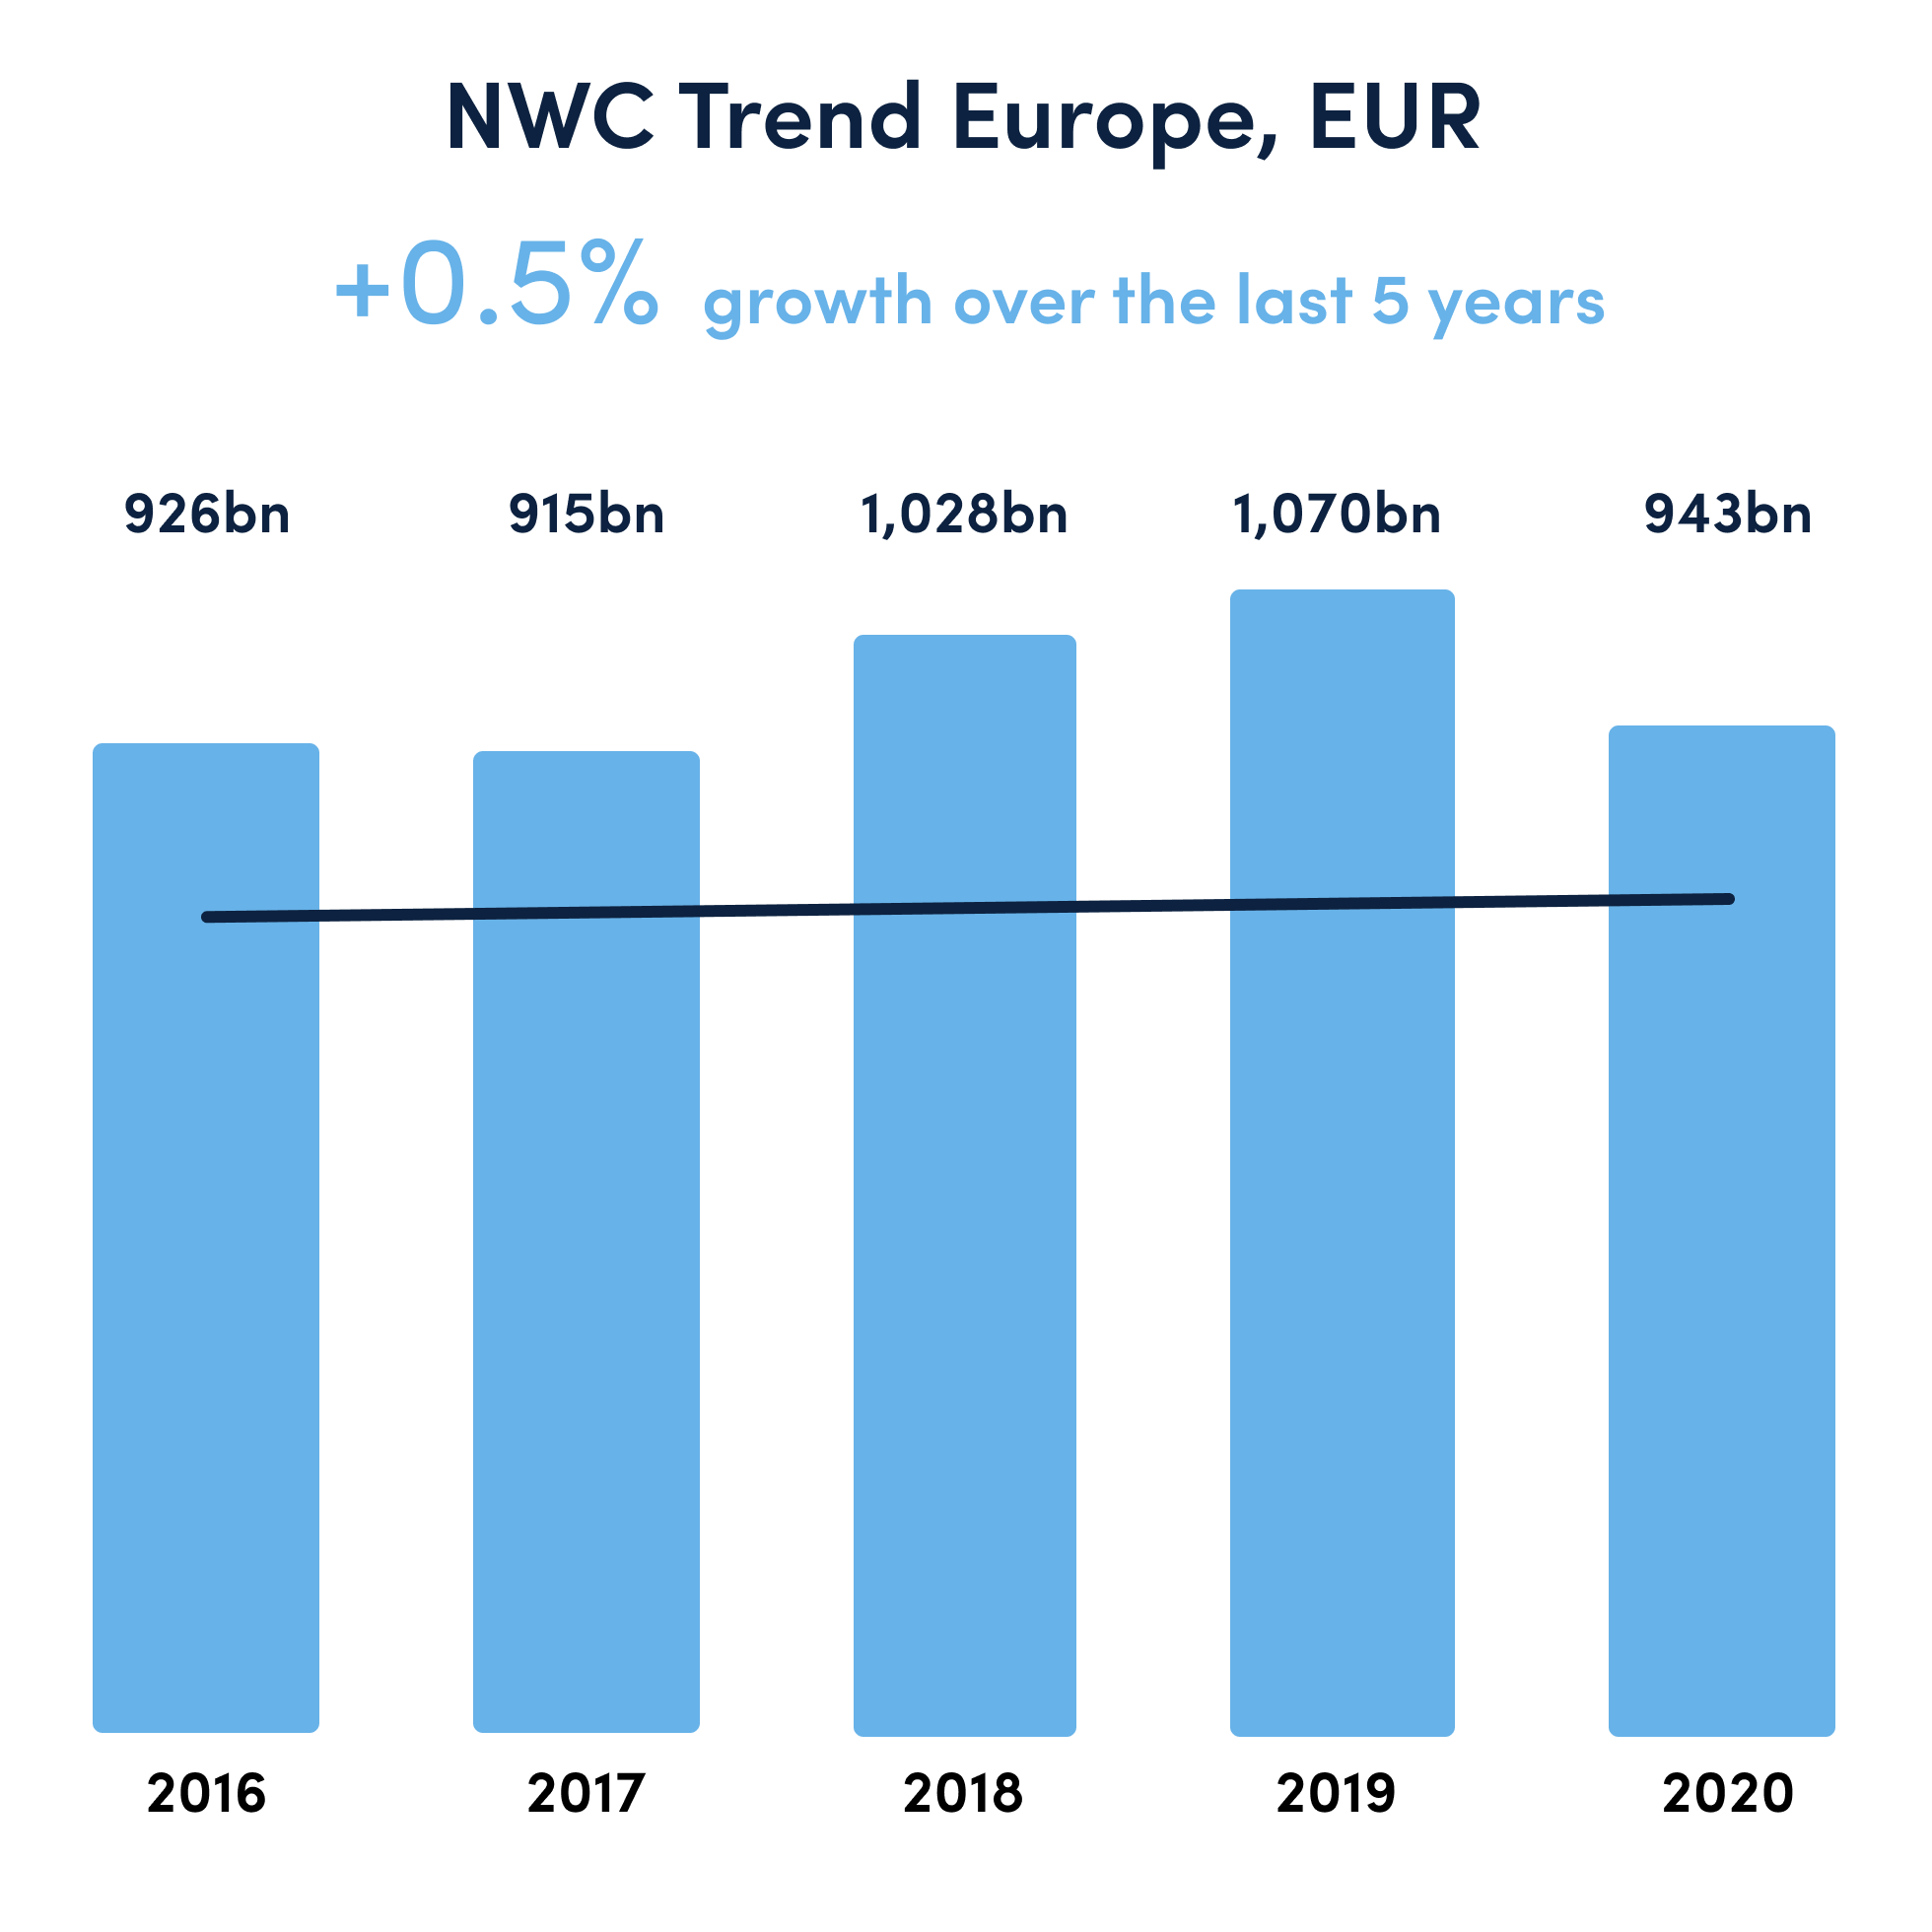
At the end of 2020, 0.9 trillion EUR was tied in working capital in over 2,500 analysed European companies that have published their financials (see opposite).
This total amount of cash tied in daily operations – also known as the net working capital (NWC) – has grown with a 0.5% compound annual growth rate (CAGR) over the last 5 years.
In line with this NWC increase, the average cash conversion cycle (CCC) has deteriorated over the last 5 years, currently being at 47 days.
This indicates that the majority of European businesses have let their working capital increase at the same pace as their revenue (0.4% in the period), losing sight of structural improvements of working capital underlying processes.

However, a handful of companies have managed to consistently outperform the market by decreasing their CCC to 21 days, when the market increased it by one, to 47 days (see opposite).
It is no surprise that the companies that have consistently focussed on optimising working capital have also shown the greatest improvement in revenue and EBITDA.

The largest performance gap between the consistent improvers and the broader market lies in receivables, in which the consistent improvers have an 11 day edge to the market average
While inventories and receivables have remained stable for the average company, payables have decreased in the last 5 five years. Conversely, consistent improvers have been able to collect faster, pay later and manage their inventories more effectively, therefore improving their CCC
Consistent and sustainable improvements in working capital require complex structural alignment at the very core of the business. Only 4% of European companies have managed to do just this. Contrary to the common perception, these companies have also outperformed the market in EBITDA.
Overall average cash conversion cycle across all industries improved between 2019 and 2020. However, more industries saw a deterioration than those that managed to improve their CCC. And while the best performing sector, Producer Manufacturing, improved by almost 8 days, the worst performer (Consumer Services) increased by more than 10 days.

Interestingly, the two sectors (health and electronic technology) that have the most cash tied up in their business, are amongst the ones that have further increased their cash locked in, by approximately 2.4% (see chart below). These industries are characterized by long sales cycles, offset by long payables towards suppliers (both DSO and DPO over 70 days), but almost all the increase is driven by a growth in inventories (DIO over 120 days). Overall these industries have not managed to leverage their supply or customer base, but rather have invested substantial amounts of cash into inventories.

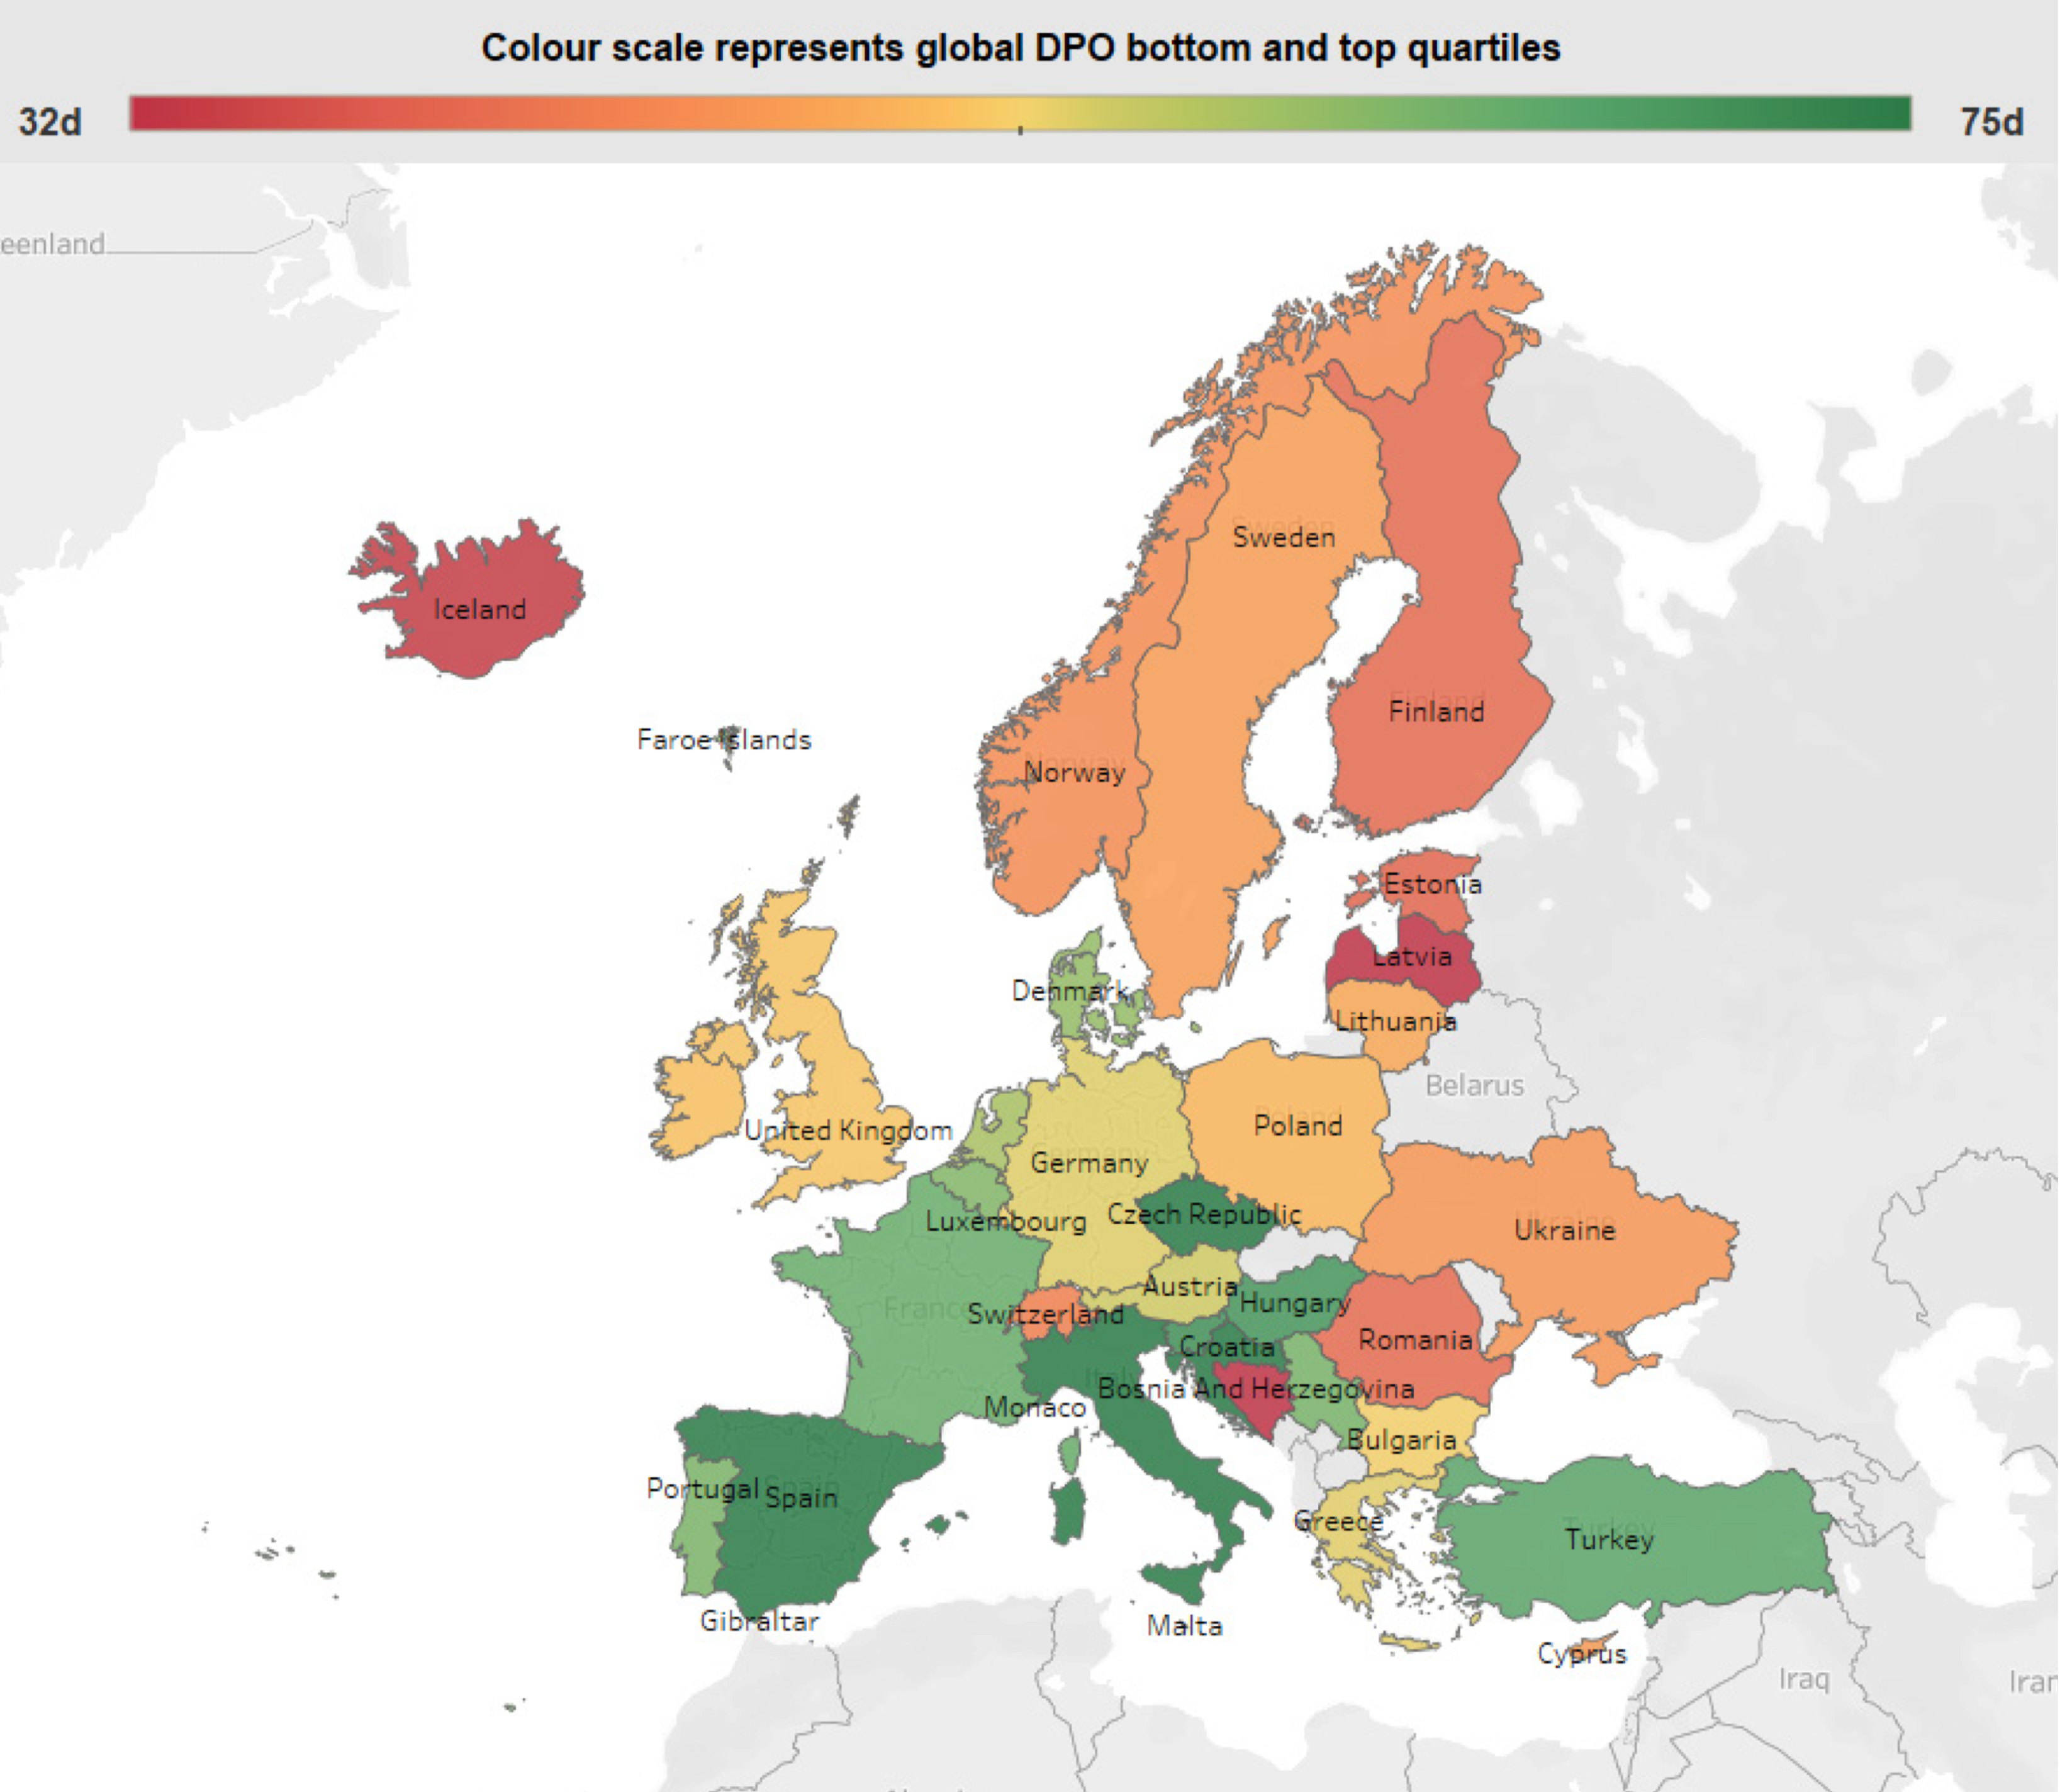
Even though the EU legislation on payment terms and on-time payment is shared between the member states, it is important to note that there is a great contrast in cash culture between countries and regions. In Europe, the regional discrepancy is particularly striking in payables (DPO), with the South outperforming the North (see opposite).
The key drivers of this performance gap are typically longer payment terms in the South and typically fewer late payments in the North. It is important to consider these regional peculiarities in cash culture to maximise the impact of a working capital improvement initiative.
Annual reports of listed firms confirm that working capital has been an area of focus during the COVID-19 emergency period, with a small improvement of the cash conversion cycle, mostly through payables.
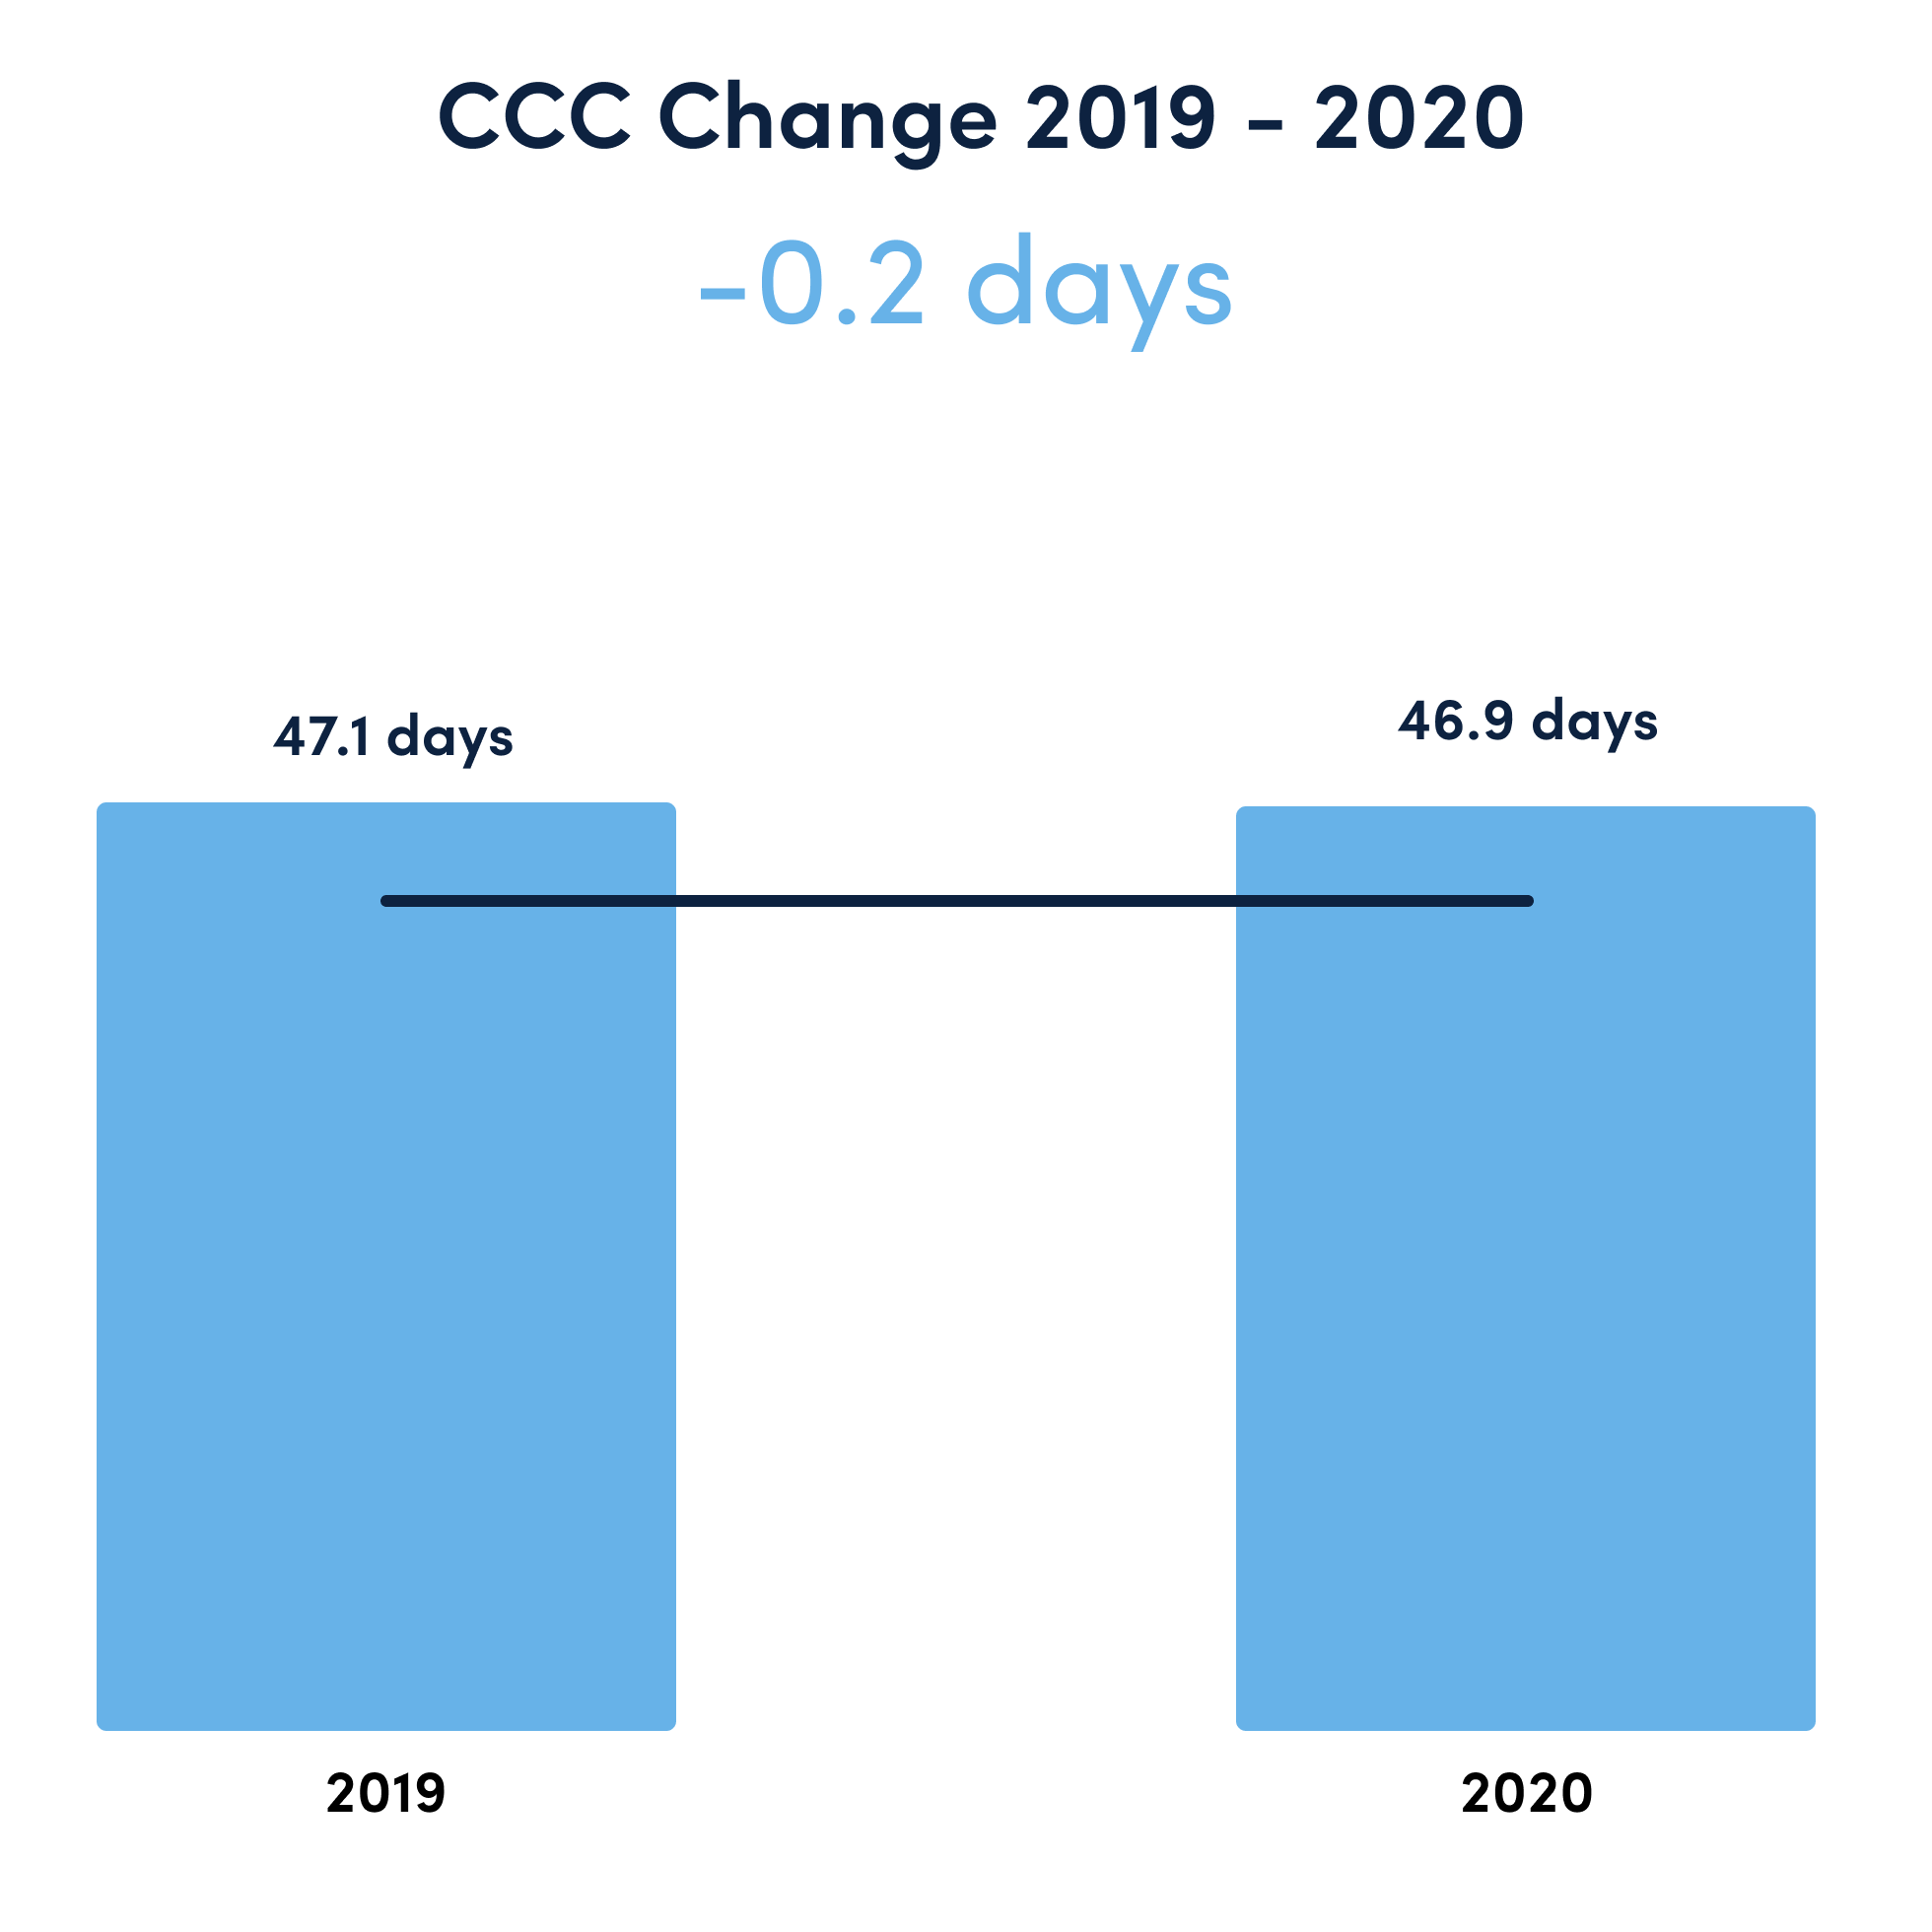
CCC dropped by 0.2 days across all industries. Some of the leading industries are cash-poor sectors like retail or distribution services, for which rapid improvement of working capital has been crucial to ensure operational viability of these businesses.
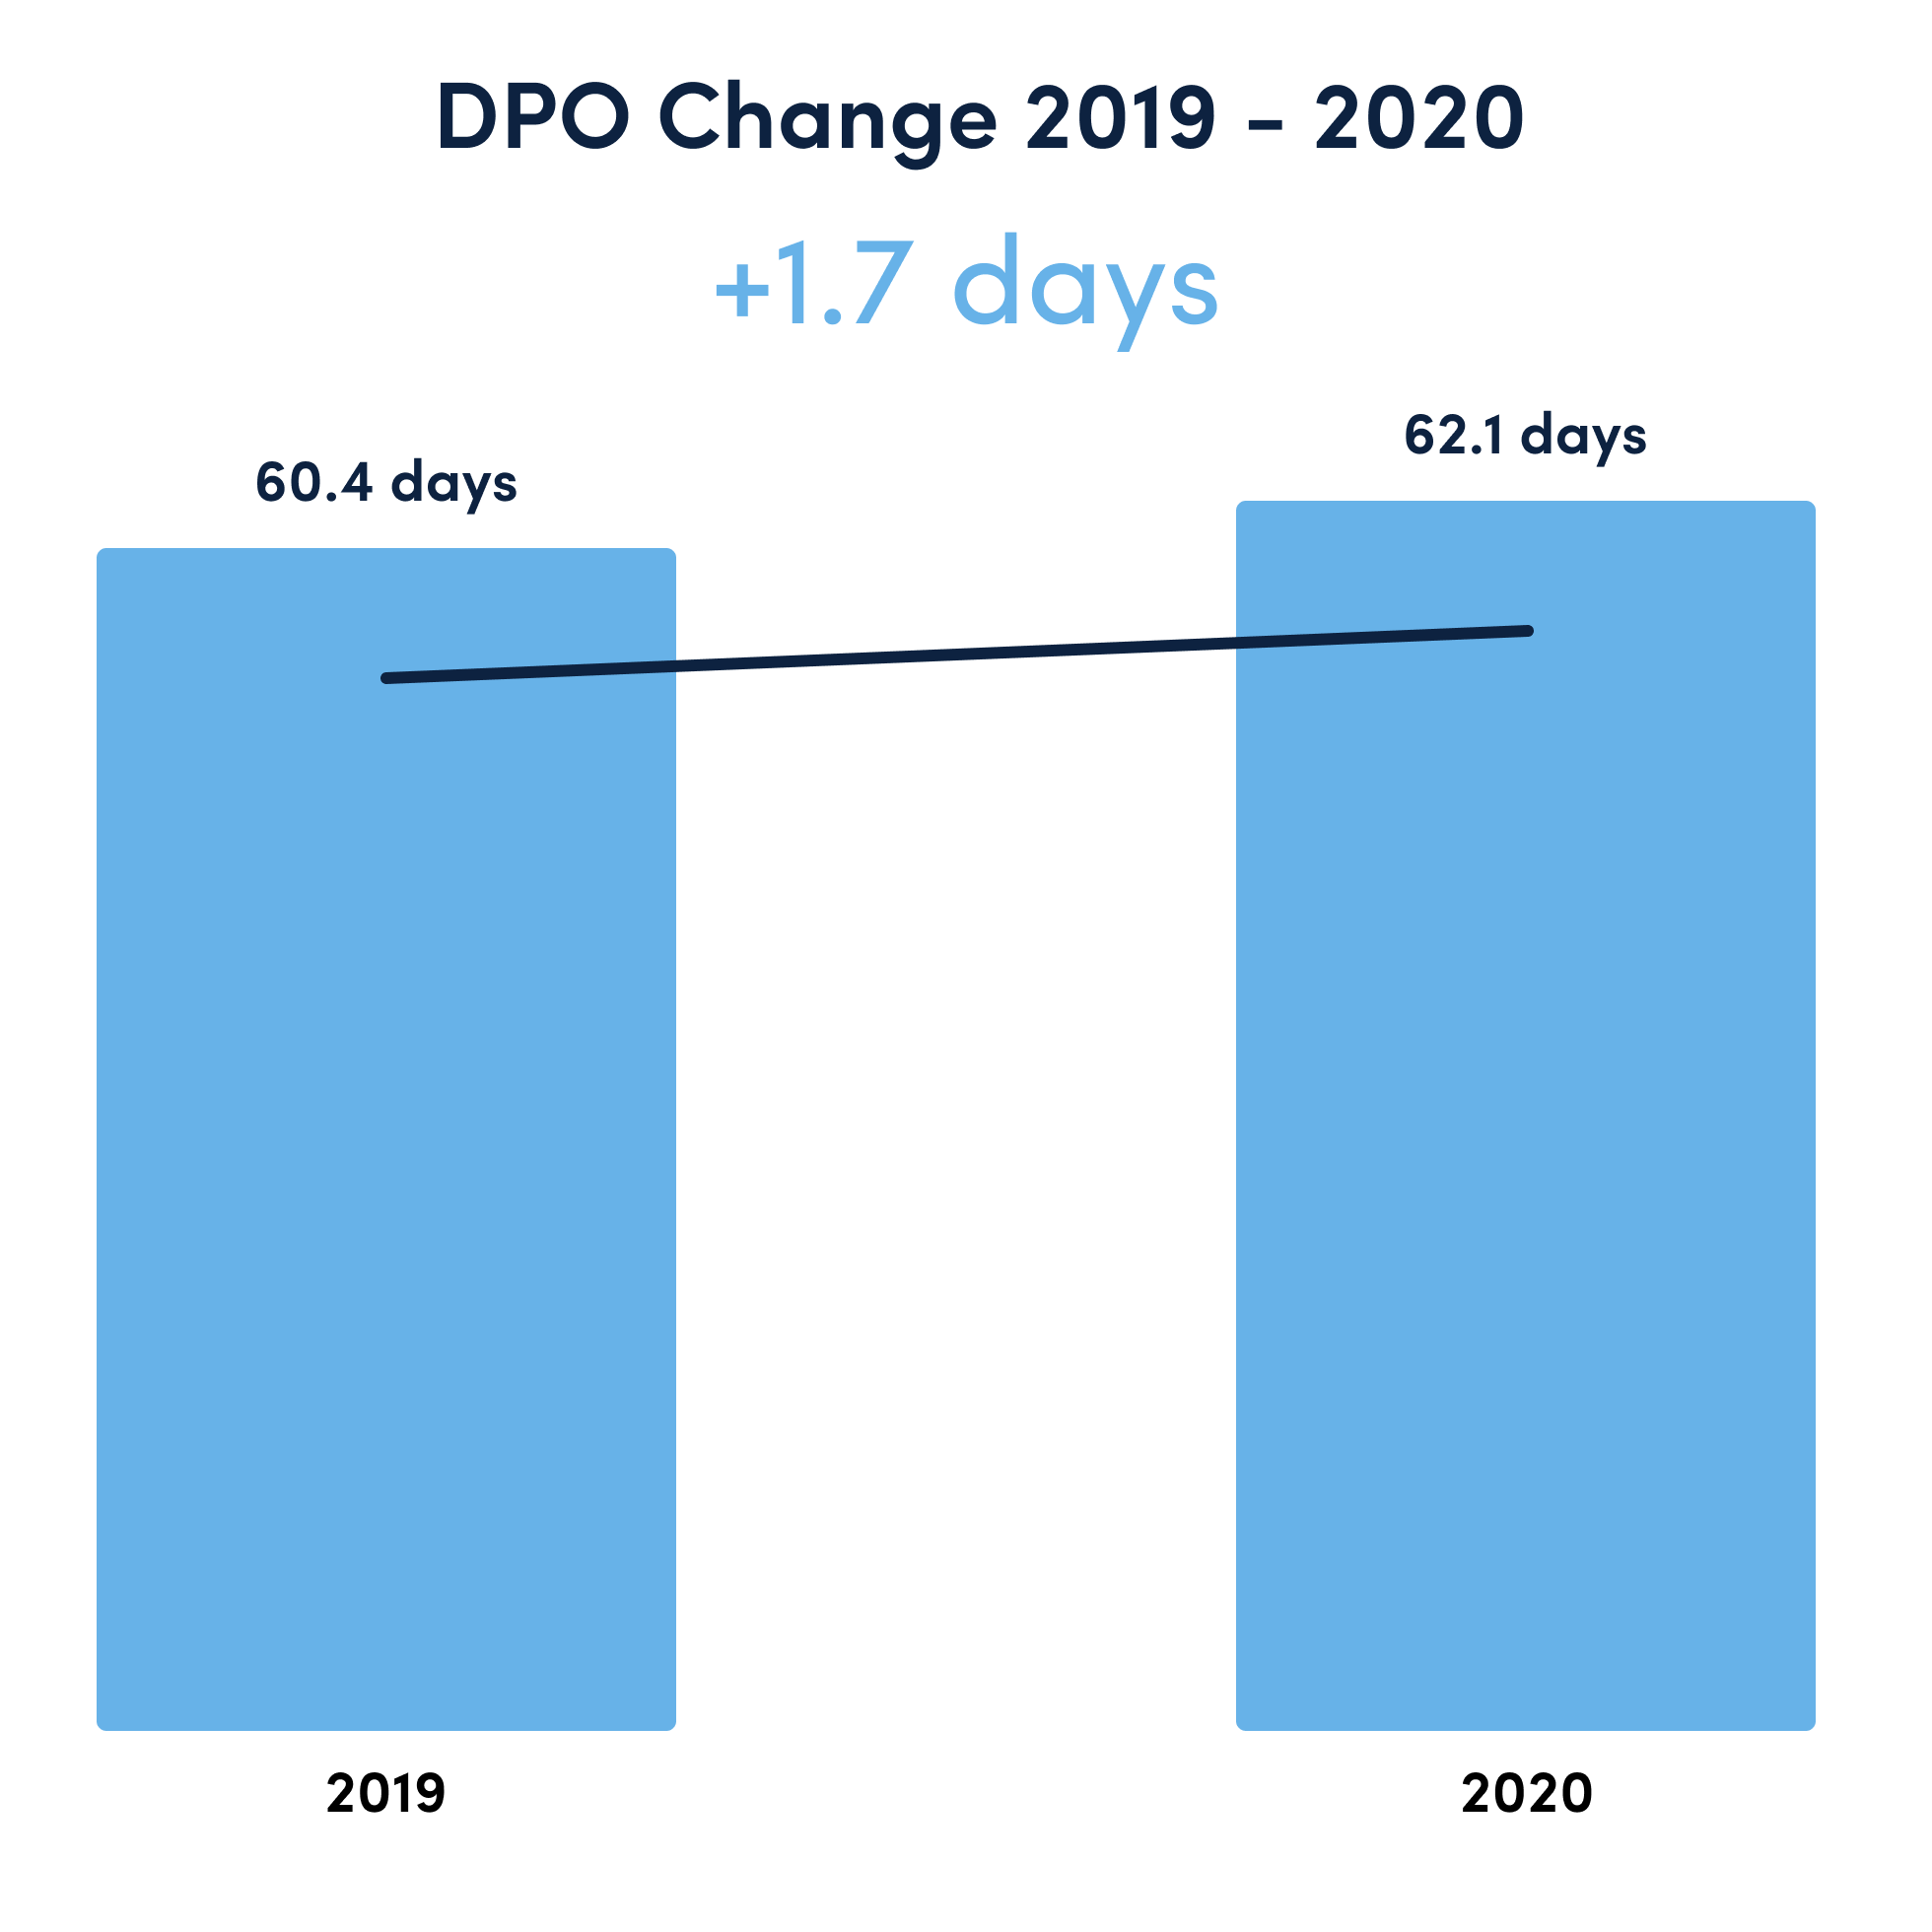
The charts below show a breakdown of the CCC by each of the operational working capital components: Payables (DPO), Inventory (DIO) and Receivables (DSO). It can immediately be observed that leveraging suppliers to increase payables has been the main driver used by these companies to boost their working capital, illustrated by the DPO improvement of almost 2 days.
Also, these anomalous annual CCC gains are likely to be temporary in nature. To obtain sustainable cash benefits from working capital, companies need to look past forcing longer payment terms to their supply base or even withholding due payments to improve their underlying purchase to pay (P2P), order to cash (O2C) and supply chain processes.


Improving the CCC not only reduces working capital requirements, but it also correlates to increased profitability. Our analysis on over 2,500 listed European companies shows that the firms that have consistently improved their cash conversion cycle in the last five years have also gained an advantage in terms of increased EBITDA, as compared to those that didn’t improve their cash conversion or have experienced a decline.
As can be seen in the charts below, consistent improvers on the right-hand side enhanced CCC by 68% whilst increasing EBITDA by 3.2%, compared to a CCC performance loss of 5.1% and EBITDA increase of only 1.2% in the group on the left-hand side.

While most companies only improved their CCC by 5.1% and EBITDA by 1.2%

Consistent improvers (defined as companies that have improved CCC year on year between 2016 and 2020), have reduced their CCC by 68% whilst increasing EBITDA by 3.2%
Don't miss our webinar recording, where Emilio Della Bruna and Ernesto Muñiz present Working Capital trends in Europe and discuss what companies can do better now to prepare for the future.
In the COVID-19 context, or any other crisis that creates scarcity of cash availability, continuous management focus to improve cash management processes is extremely important as both optimised working capital and EBITDA contribute to higher free-cash-flow – which directly correlates to business resilience during periods of crisis.